Compostition of Galaxies
Megan Argo
2nd Year Laboratory Report
Department Of Physics And Astronomy
University Of Manchester
Abstract
Using line profiles of the 21 cm
line, obtained in September 1982 using the 76 metre Mk 1 telescope at
Jodrell Bank, ten galaxies (NGC 891, 1055, 1073, 1232, 2835, 2841,
3511, 5161, 5236 and 6210) were compared.
The total mass contained in each
galaxy was found by using the Doppler width of the hydrogen profiles
and a simple model of mass distribution within disk galaxies. The
mass of neutral hydrogen in each galaxy was calculated from the
hydrogen line luminosities of the profiles.
The ratio of the two masses was
then calculated and a comparison was made of the two types of
galaxies included in the survey, namely types Sb and Sc. The average
mass ratio for Sb galaxies is (1.264 G 0.030)
% and for Sc galaxies, (2.598 G
0.460) %
1. Introduction
Galaxies
Galaxies
are classified according to their structure and, like snowflakes, the
shape of each one is unique. There are four general categories,
spirals which make up about 83% of the local population, elliptical
galaxies which constitute about 13%, roughly 3% are irregular
galaxies and the remaining 1% are classified as peculiar as they do
not fit into any other category.
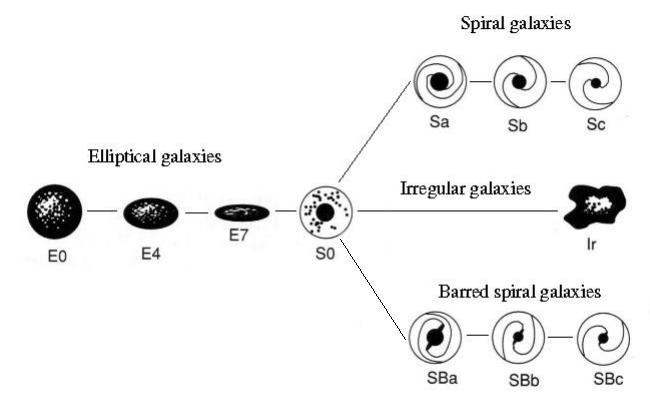 Disk
galaxies are split up into three main sub categories, lenticulars,
spirals and barred spirals. The classification, introduced by Hubble,
is shown in figure 1. This is known as the tuning fork diagram
and shows the various types of galaxy schematically. Lenticulars are
flat ellipses that do not have spiral arms and are classified by the
degree of ellipticity. The subject of this study is the composition
of spiral galaxies.
Disk
galaxies are split up into three main sub categories, lenticulars,
spirals and barred spirals. The classification, introduced by Hubble,
is shown in figure 1. This is known as the tuning fork diagram
and shows the various types of galaxy schematically. Lenticulars are
flat ellipses that do not have spiral arms and are classified by the
degree of ellipticity. The subject of this study is the composition
of spiral galaxies.
Fig
1 [2, 133]
Spirals
have a nucleus which consists of population II
(older, metal poor) stars, spiral arms which contain population I
(younger, metal rich) stars and clouds of interstellar neutral
hydrogen (HI), and a halo of
population II stars and small
globular clusters. In spiral galaxies, the classification progresses
from Sa galaxies with prominent central bulges and tightly wound
spiral arms, through to Sc galaxies with much smaller bulges and
looser arms.
Within
galaxies there exists an interstellar medium (the ISM) containing
large, low density clouds consisting mainly of HI
gas. They are hard to see in the optical but they are visible at
radio frequencies due to the spin-flip transition.
Hydrogen
also exists in other forms in the ISM. Clouds of molecular hydrogen
(H2) are present in star forming regions but they are not
easily observed because H2 is easily dissociated by the
intense ultraviolet radiation from the newly formed stars. In star
forming regions, hydrogen ionised by young hot stars (HII)
radiates in the infrared (thermal emission) and radio
(bremsstrahlung) regions of the spectrum.
HI Emission
Protons and electrons both have an
intrinsic spin of ½. In a hydrogen atom the spins of the
proton and electron can be aligned parallel or anti-parallel to each
other, with the second state having a slightly greater energy then
the first. An electron in the slightly higher state will flip to the
lower state and the slight change in energy is released as a photon
with a characteristic frequency. For HI,
this frequency is 1420.405752 Mhz (corresponding to a
wavelength of 0.21106 m). This process has a very low
probability of occurring and in high density clouds the atoms are
more likely to loose energy in collisions before the transition takes
place, hence it is only observed in cool, low density clouds.
From
observations of external galaxies at this characteristic frequency
much useful information can be obtained. The radial velocity of the
gas at the edge of the disk can be determined from the Doppler shift
in the observed frequency, and these observations can show the
motions of the spiral arms. [1, 139] The observations can also be
used to calculate a galaxies distance, velocity, total mass and the
mass of neutral hydrogen contained within it.
2. Theory
Mass Distribution
The
velocity of matter in a galaxy at any radius R is determined only by
the total mass contained within the orbit. This can be thought of as
being concentrated at a point at the centre of the orbit. The mass
outside the orbit has no effect as the forces from masses on opposite
sides of the galaxy will cancel each other out since the distribution
is symmetrical.
The
total mass of stars, dust and gas contained within a galaxy can be
determined by finding the velocity of matter at the Holmberg radius,
Rmax . This is the radius at which the surface brightness
is measured to be 25.6 magnitudes per square arcsecond (1 - 2 %
of the brightness of the background sky) in blue light [3, 219]. The
Holmberg radius is the maximum radius at which the constituents of
the galaxy follow an almost circular orbit around the galactic
centre.
The
total mass, MT, can be found by equating the gravitational
and centrifugal forces acting on a small mass, m, moving at velocity
v at a radius of Rmax to give
 (1)
(1)
where G is
the gravitational constant.
Finding
Rmax
The radius
Rmax is calculated from the distance and observed angular
diameter of the galaxy and is given by
 (2)
(2)
where å
is the angular diameter and D is the distance, calculated from
Hubble's Law
 (3)
(3)
where H0
is Hubble's constant and VR is the radial velocity
determined from a hydrogen line profile and corrected for the
observers motion.
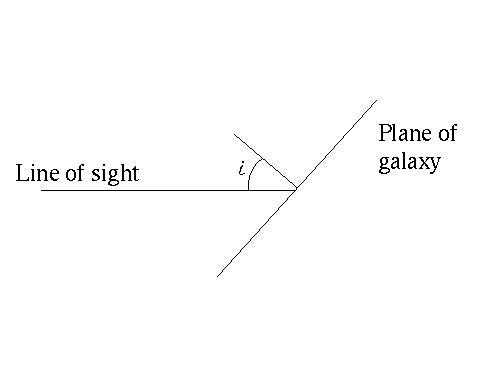
Finding
v
A hydrogen
profile for a galaxy will only provide the line of sight component of
the velocity of the gas at Rmax . The relationship between
the actual velocity (v) required in equation (1) and the apparent
velocity (vi) within
the galaxy is
 (4)
(4)
where
i is the
angle of inclination of the galaxy to the line of sight of the
observer.
Line
Luminosities and Hydrogen Mass
The rate of emission from each
hydrogen atom is known, and so the total number of hydrogen atoms
present in the galaxy, NH , is found by integrating the
flux density of the hydrogen line profile of the galaxy with respect
to frequency.
If D is the distance from the
observer to the galaxy in parsecs, and is the same as that found by
equation (3), and S is the flux density at frequency v in Jansky's,
then
 (5)
(5)
where the coefficient K
= 5.91 D 1046.
The total mass of HI
contained in the galaxy is then given by
 (6)
(6)
where mp and me
are the rest masses of a proton and an electron respectively.
3. Experimental Method
Total
mass
Line
profiles of the 21 cm line were obtained for each of the ten galaxies
included in this study using the Mk 1 radio telescope at Jodrell
Bank, UK in September 1982.
There
is a centre frequency shift in each of the profiles due to the
apparent velocity of the galaxies, see table 1. This shift was used
to find the distance from the observer to each galaxy using equation
(3). However in this equation,
 (7)
(7)
where VA
is the apparent radial velocity of the galaxy and VC is
the correction needed for the motion of the observer which also had
to be determined.
For galaxies
such as these at distances of between 1 and 30 Mpcs, VA is
found from the non-relativistic Doppler equation
 (8)
(8)
where ÇÛ
is the change in wavelength from Û,
the rest wavelength and c is the speed of light.
The
correction, VC, to VA for the solar, and hence
the Earth's, velocity, is given by
 (9)
(9)
where
VM is the velocity of the Sun
around the galactic centre and l
and b correspond to the position of the galaxy converted from RA+Dec
to galactic co-ordinates using the following equations;
 (10)
(10)
 (11)
(11)
 (12)
(12)
where
l and b are galactic longitude
and latitude, R and D are the right ascension and declination of the
object in degrees, Rg =12h49m
and Dg =+27.4o
are the right ascension and declination of the North Galactic pole,
and lp =123o
is the longitude of the North Celestial pole.
With
the distances known, the Holmberg radius, Rmax , was found
for each galaxy using equation (2) and the angular diameters which
are listed in table 1. The gas at Rmax has the greatest
velocity relative to the observer due to the rotation of the galaxy.
Hence the most negative and most positive velocities (the velocities
at the edges of the profiles) correspond to the velocity of the gas
at Rmax .
The
apparent velocity, vi, at the edges of the disk was found
by measuring the width of each profile in Mhz and using equation (3)
again, with Û now the centre
frequency of the profile. However, vi is not the actual
orbital velocity of the gas as the galaxies are not all perfectly
side on to our line of sight. The correction to get the actual
velocity, v, is given by equation (4) where the angle of inclination
of the galaxy, i, is given in
table 1. See figure 2. The values for v were then used in
equation (1) along with the calculated values for the Holmberg radius
to obtain the total mass contained within each galaxy.
Fig
2
Mass
of Hydrogen
The
mass of hydrogen contained in each galaxy was found by finding the
area under each of the line profiles and then applying equations (5)
and (6). Once the two masses, MH and MT were
found, the ratio, MH / MT was calculated.
4. Results and Errors
Table 2 shows the average results
for the total mass, the mass of hydrogen, and the ratio between the
two for each type of galaxy, calculated using the method outlined in
section 3. There is a difference between the average ratios but
an analysis of the errors is required to see if this difference is
significant. The data for each galaxy is shown in figure 3.
Figure 3. The ratio of MH
to MT for all galaxies in the survey. Darker bars are Sb
and lighter bars Sc galaxies.
Table
2.
|
Type
|
Average MH (MM)
|
Average MT (MM)
|
Average MH/MT (%)
|
|
Sb
|
4.532E+9
|
4.941E+11
|
1.264
|
|
Sc
|
3.177E+9
|
3.250E+11
|
2.598
|
The significant uncertainty in the
final results arises from integrating the profiles. An analysis of
the data, using an estimated uncertainty based on the accuracy of the
original line profiles, gives uncertainties in the ratio of MH
to MT of G 0.030 %
for Sb and G 0.460 % for Sc
galaxies. Systematic uncertainties in the results also arise from the
cumulative effect of errors in the systems of distance measurement
used in astronomy and an uncertainty in the value of the Hubble
constant.
5. Discussion and Conclusion
The data shows that the average
mass ratio of MH to MT for Sb galaxies is
(1.264 G 0.030) %
and for Sc galaxies, (2.598 G 0.460) %.
Taking the errors into account, it can be seen that there is a
definite difference in the proportion of hydrogen between the two
types of galaxy.
There is a difference in the
percentage of HI between types Sb
and Sc galaxies. Going back to the Hubble classification and the
tuning fork diagram, type Sa galaxies contain the lowest, and type Sc
galaxies the highest, proportion of neutral interstellar hydrogen.
[1, 100]
6. References
B. F. Burke and F. Graham-Smith,
An Introduction to Radio Astronomy. (Cambridge University Press,
1997)
N. Ingham, Astrophysics. (Nelson,
1997) (Images taken from)
I. Ridpath, Dictionary of
Astronomy. (Oxford University Press, 1997)
Images from the Digitised Sky
Surveys which were produced at the Space Telescope Science Institute
under U.S. Government grant NAG W-2166. The images of these surveys
are based on photographic data obtained using the Oschin Schmidt
Telescope on Palomar Mountain and the UK Schmidt Telescope. The
plates were processed into the present compressed digital form with
the permission of these institutions.